The weather in Malawi
Fascinating working with brilliant developers in Malawi, Africa.
My key takeaways
- Fascinating working with brilliant developers in Malawi, Africa. Language support in mobile apps should be added early in the project.
- Doing user research from afar requires a different skill set.
- When user research is done on a large scale in less than favourable conditions, it still gives vast insight and value!
Project goal
- Saving lives
- Helping forecasters in Malawi to get dangerous weather warnings into the hands of users
- Building an easy-to-use mobile app for the people of Malawi
Aid project
With the project Sarepta, MET Norway aims to contribute to capacity building at their sister institutions, increase knowledge and expertise linked to forecasting of extreme weather events, as well as building climate and marine services. The project was funded by Norad, with in-kind contributions from MET Norway.
My role, process and method
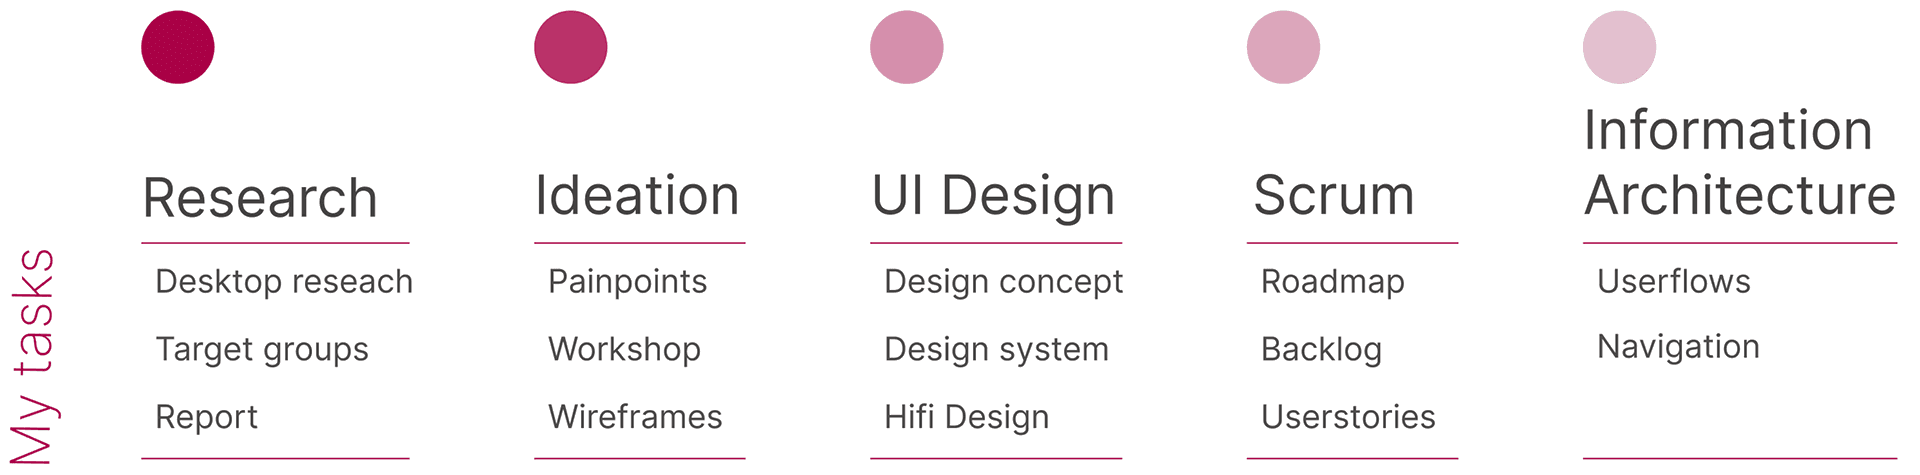
In this project, my role was UX/UI Designer. As the budget did not allow for visiting Malawi and doing on-site user research, we collaborated with Save the Children, getting help from their Shift group.
Research
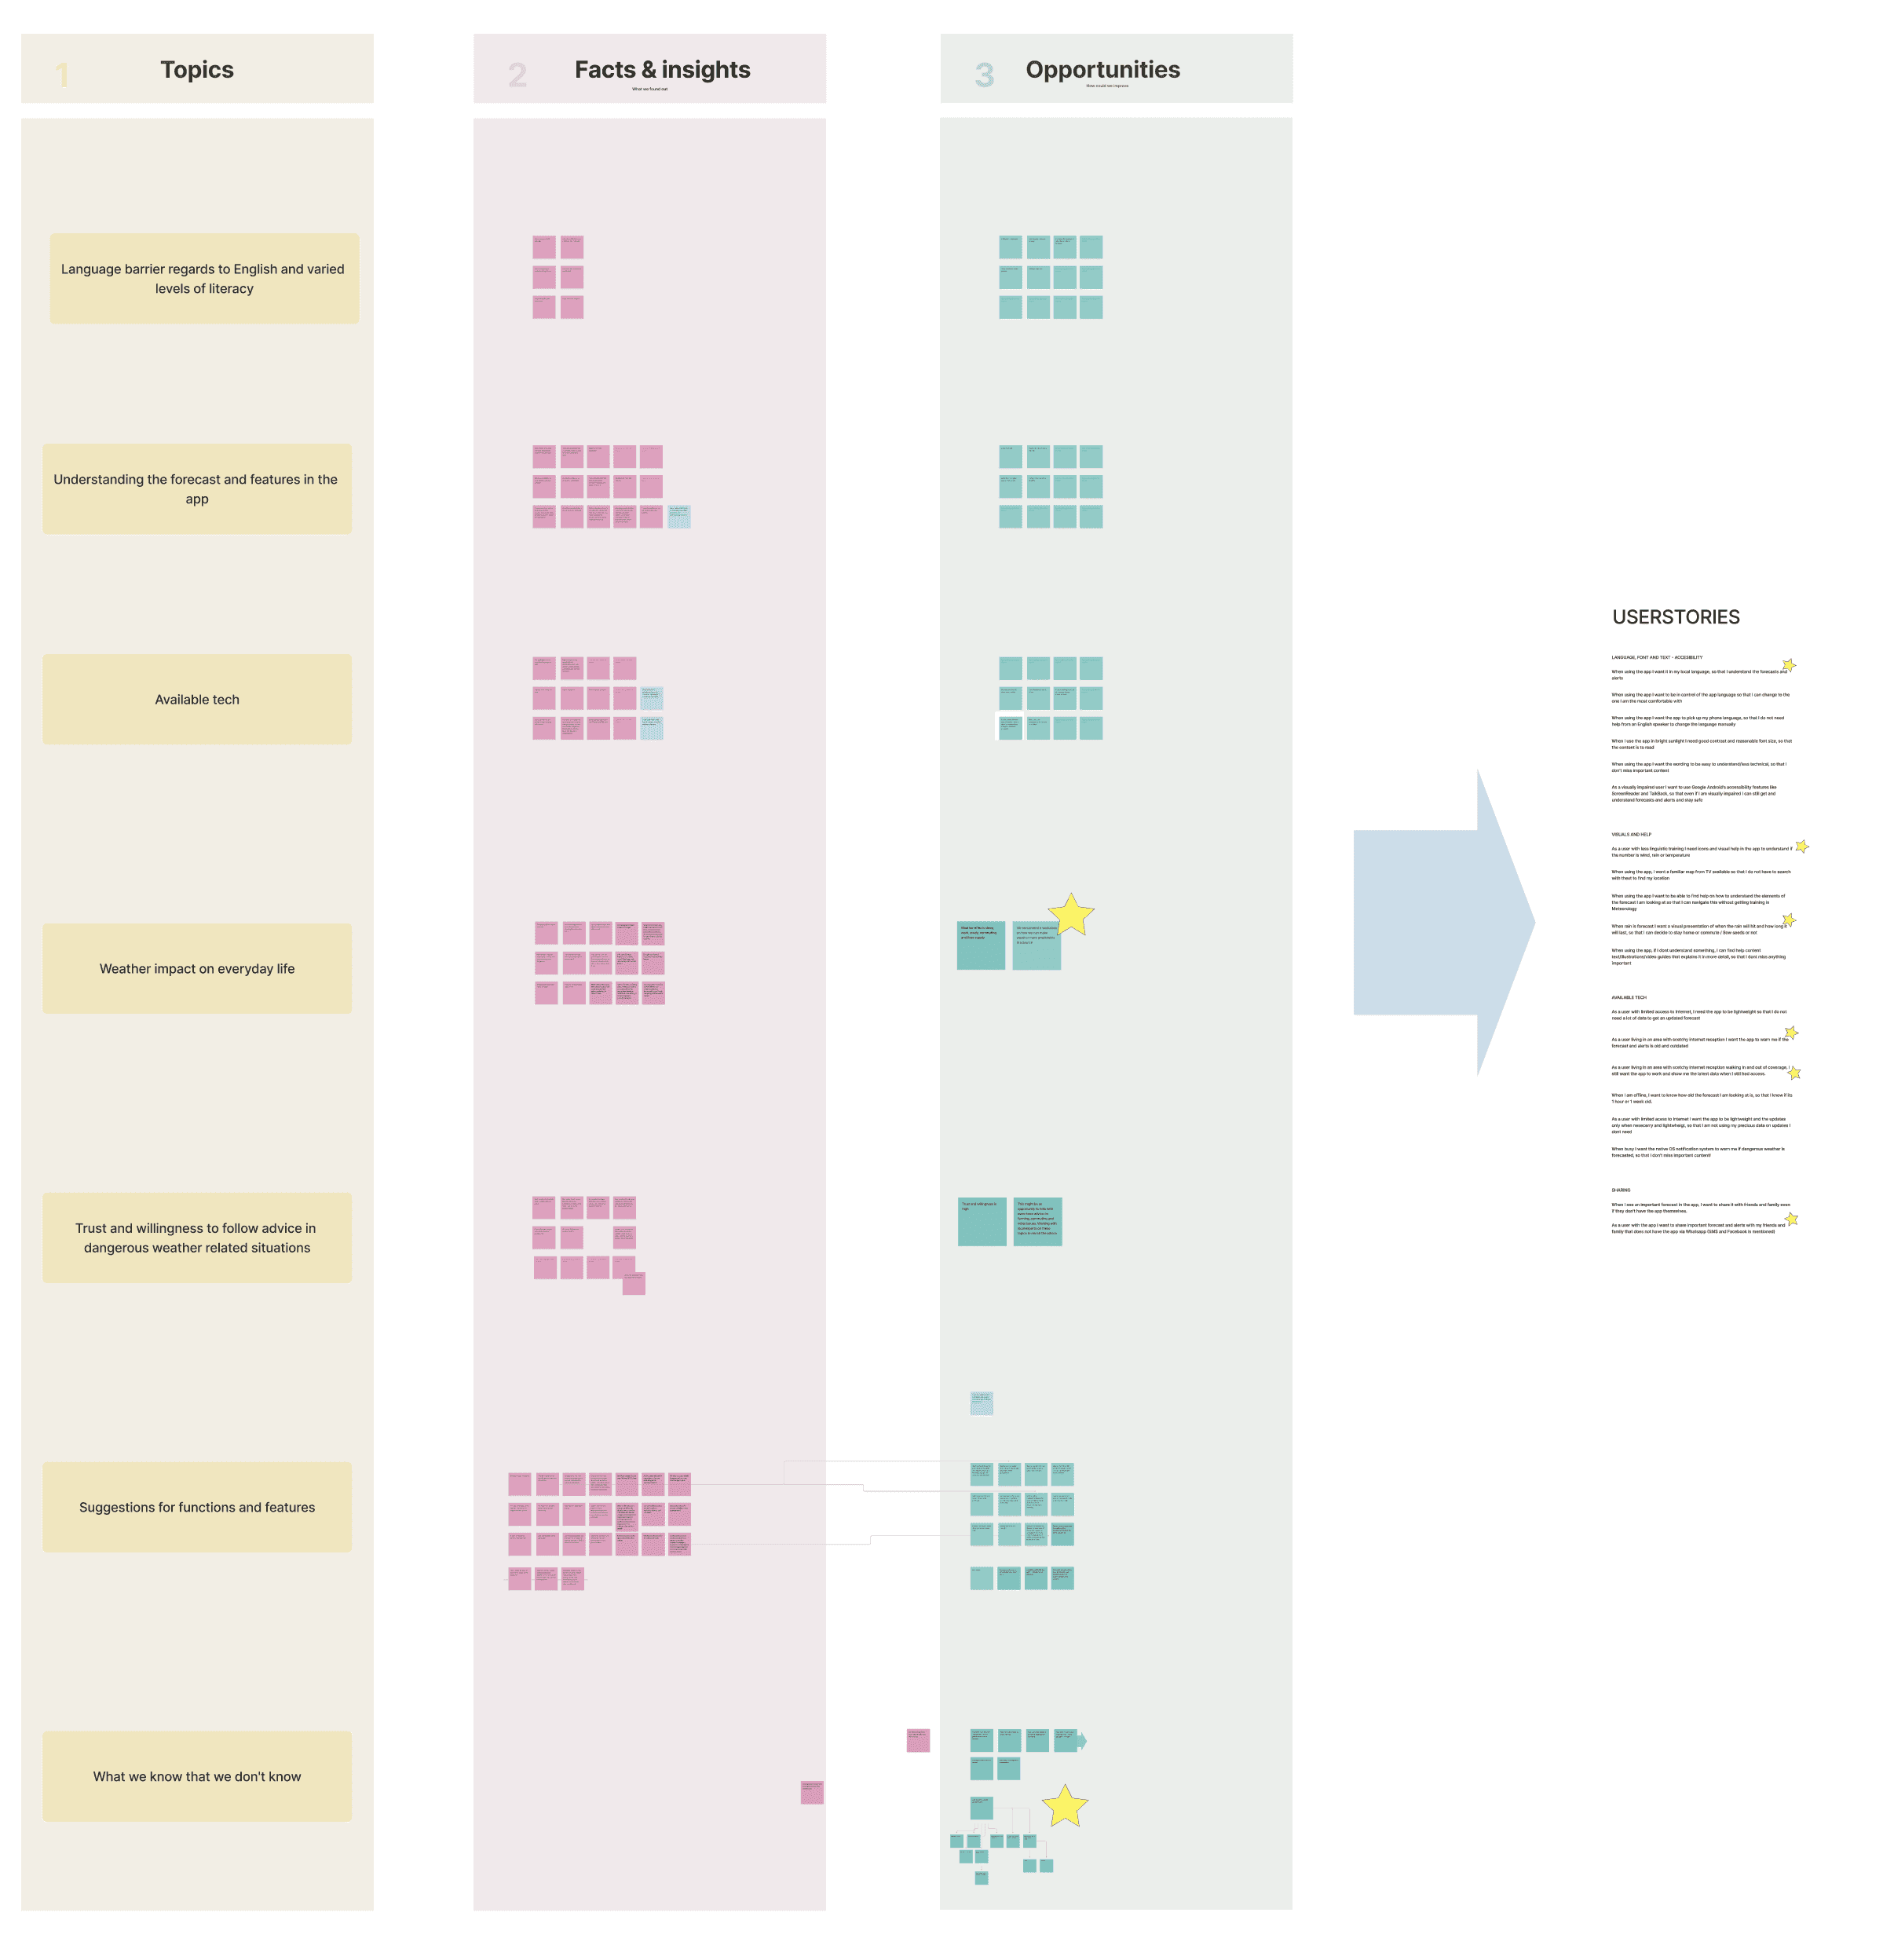
As the lead UX Designer, I collaborated with the Shift group to conduct a comprehensive user research study in Malawi. I developed a detailed interview script and created a clickable prototype to facilitate the process. Eleven Shift colleagues were assigned to carry out the interviews and user tests with 160 participants. After receiving the raw data in Excel format, I dedicated a month to analysing and synthesising the information. This thorough examination revealed numerous unexpected insights.
I transferred the findings/atoms into a reusable Atomic Research repository.
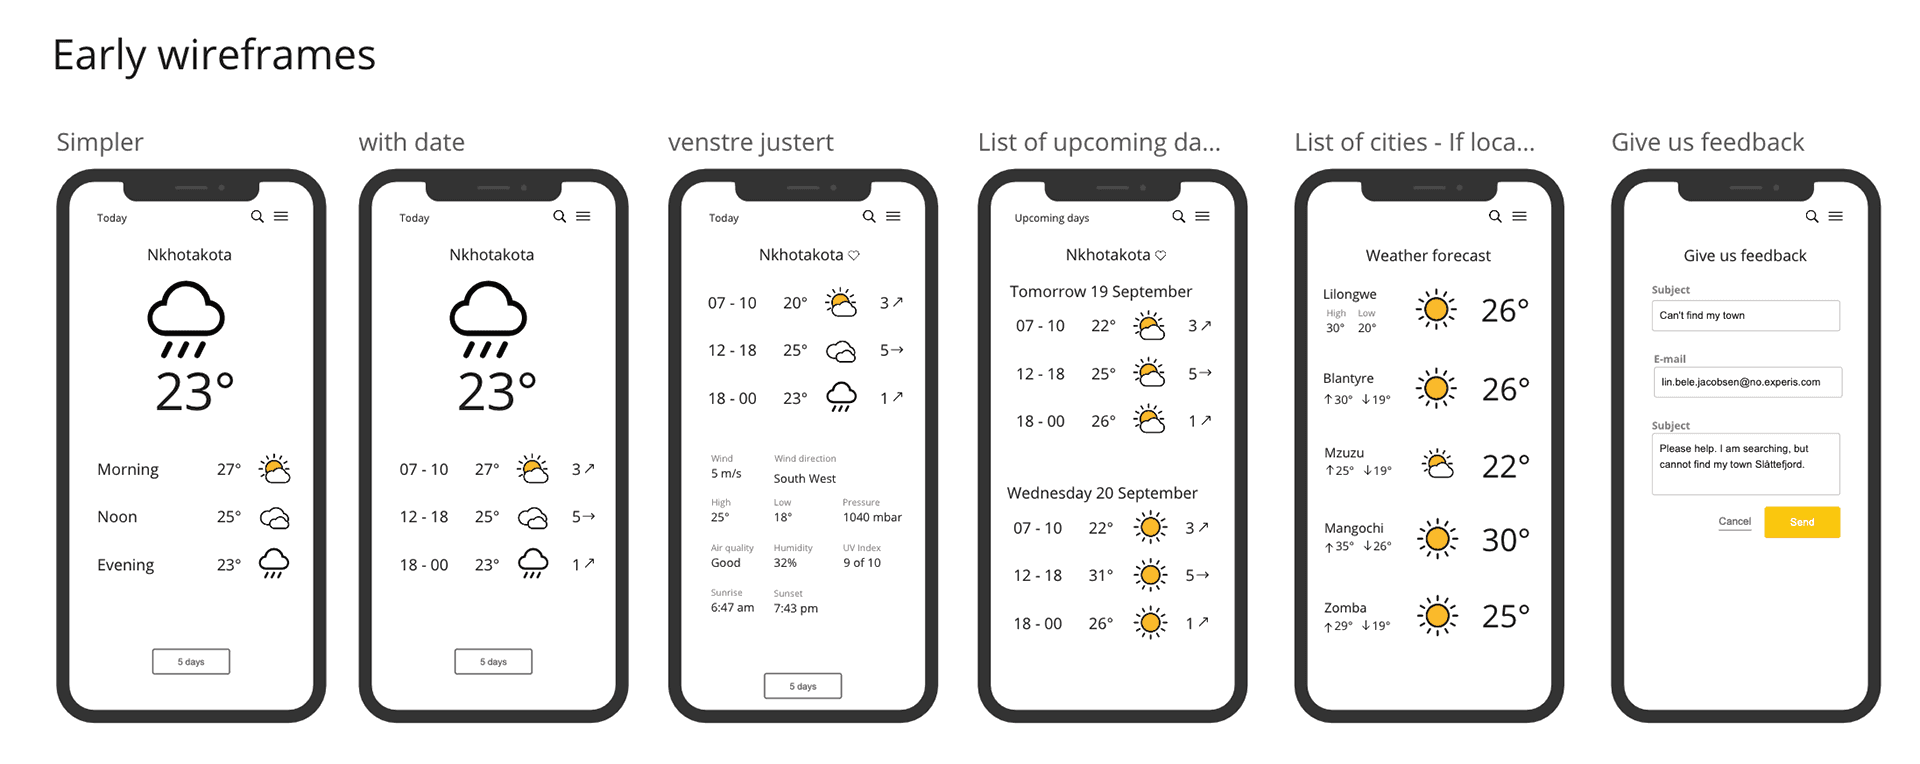
The findings were prioritised, and after some work and ideation we had user stories in a roadmap ready for the developers.
Challenges
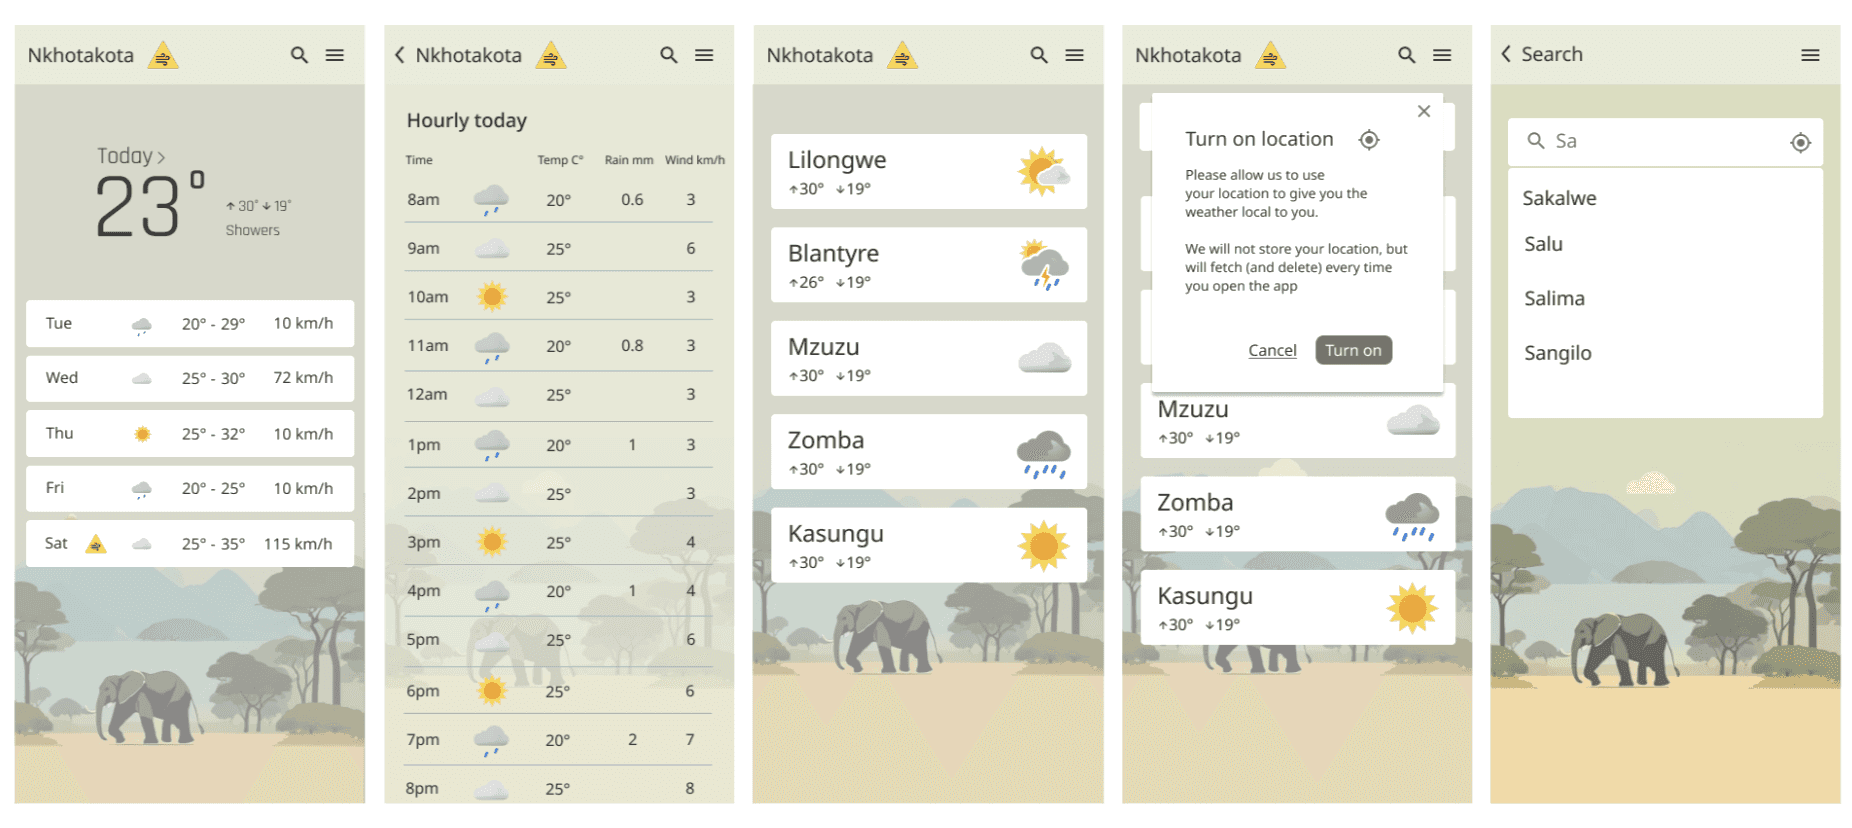
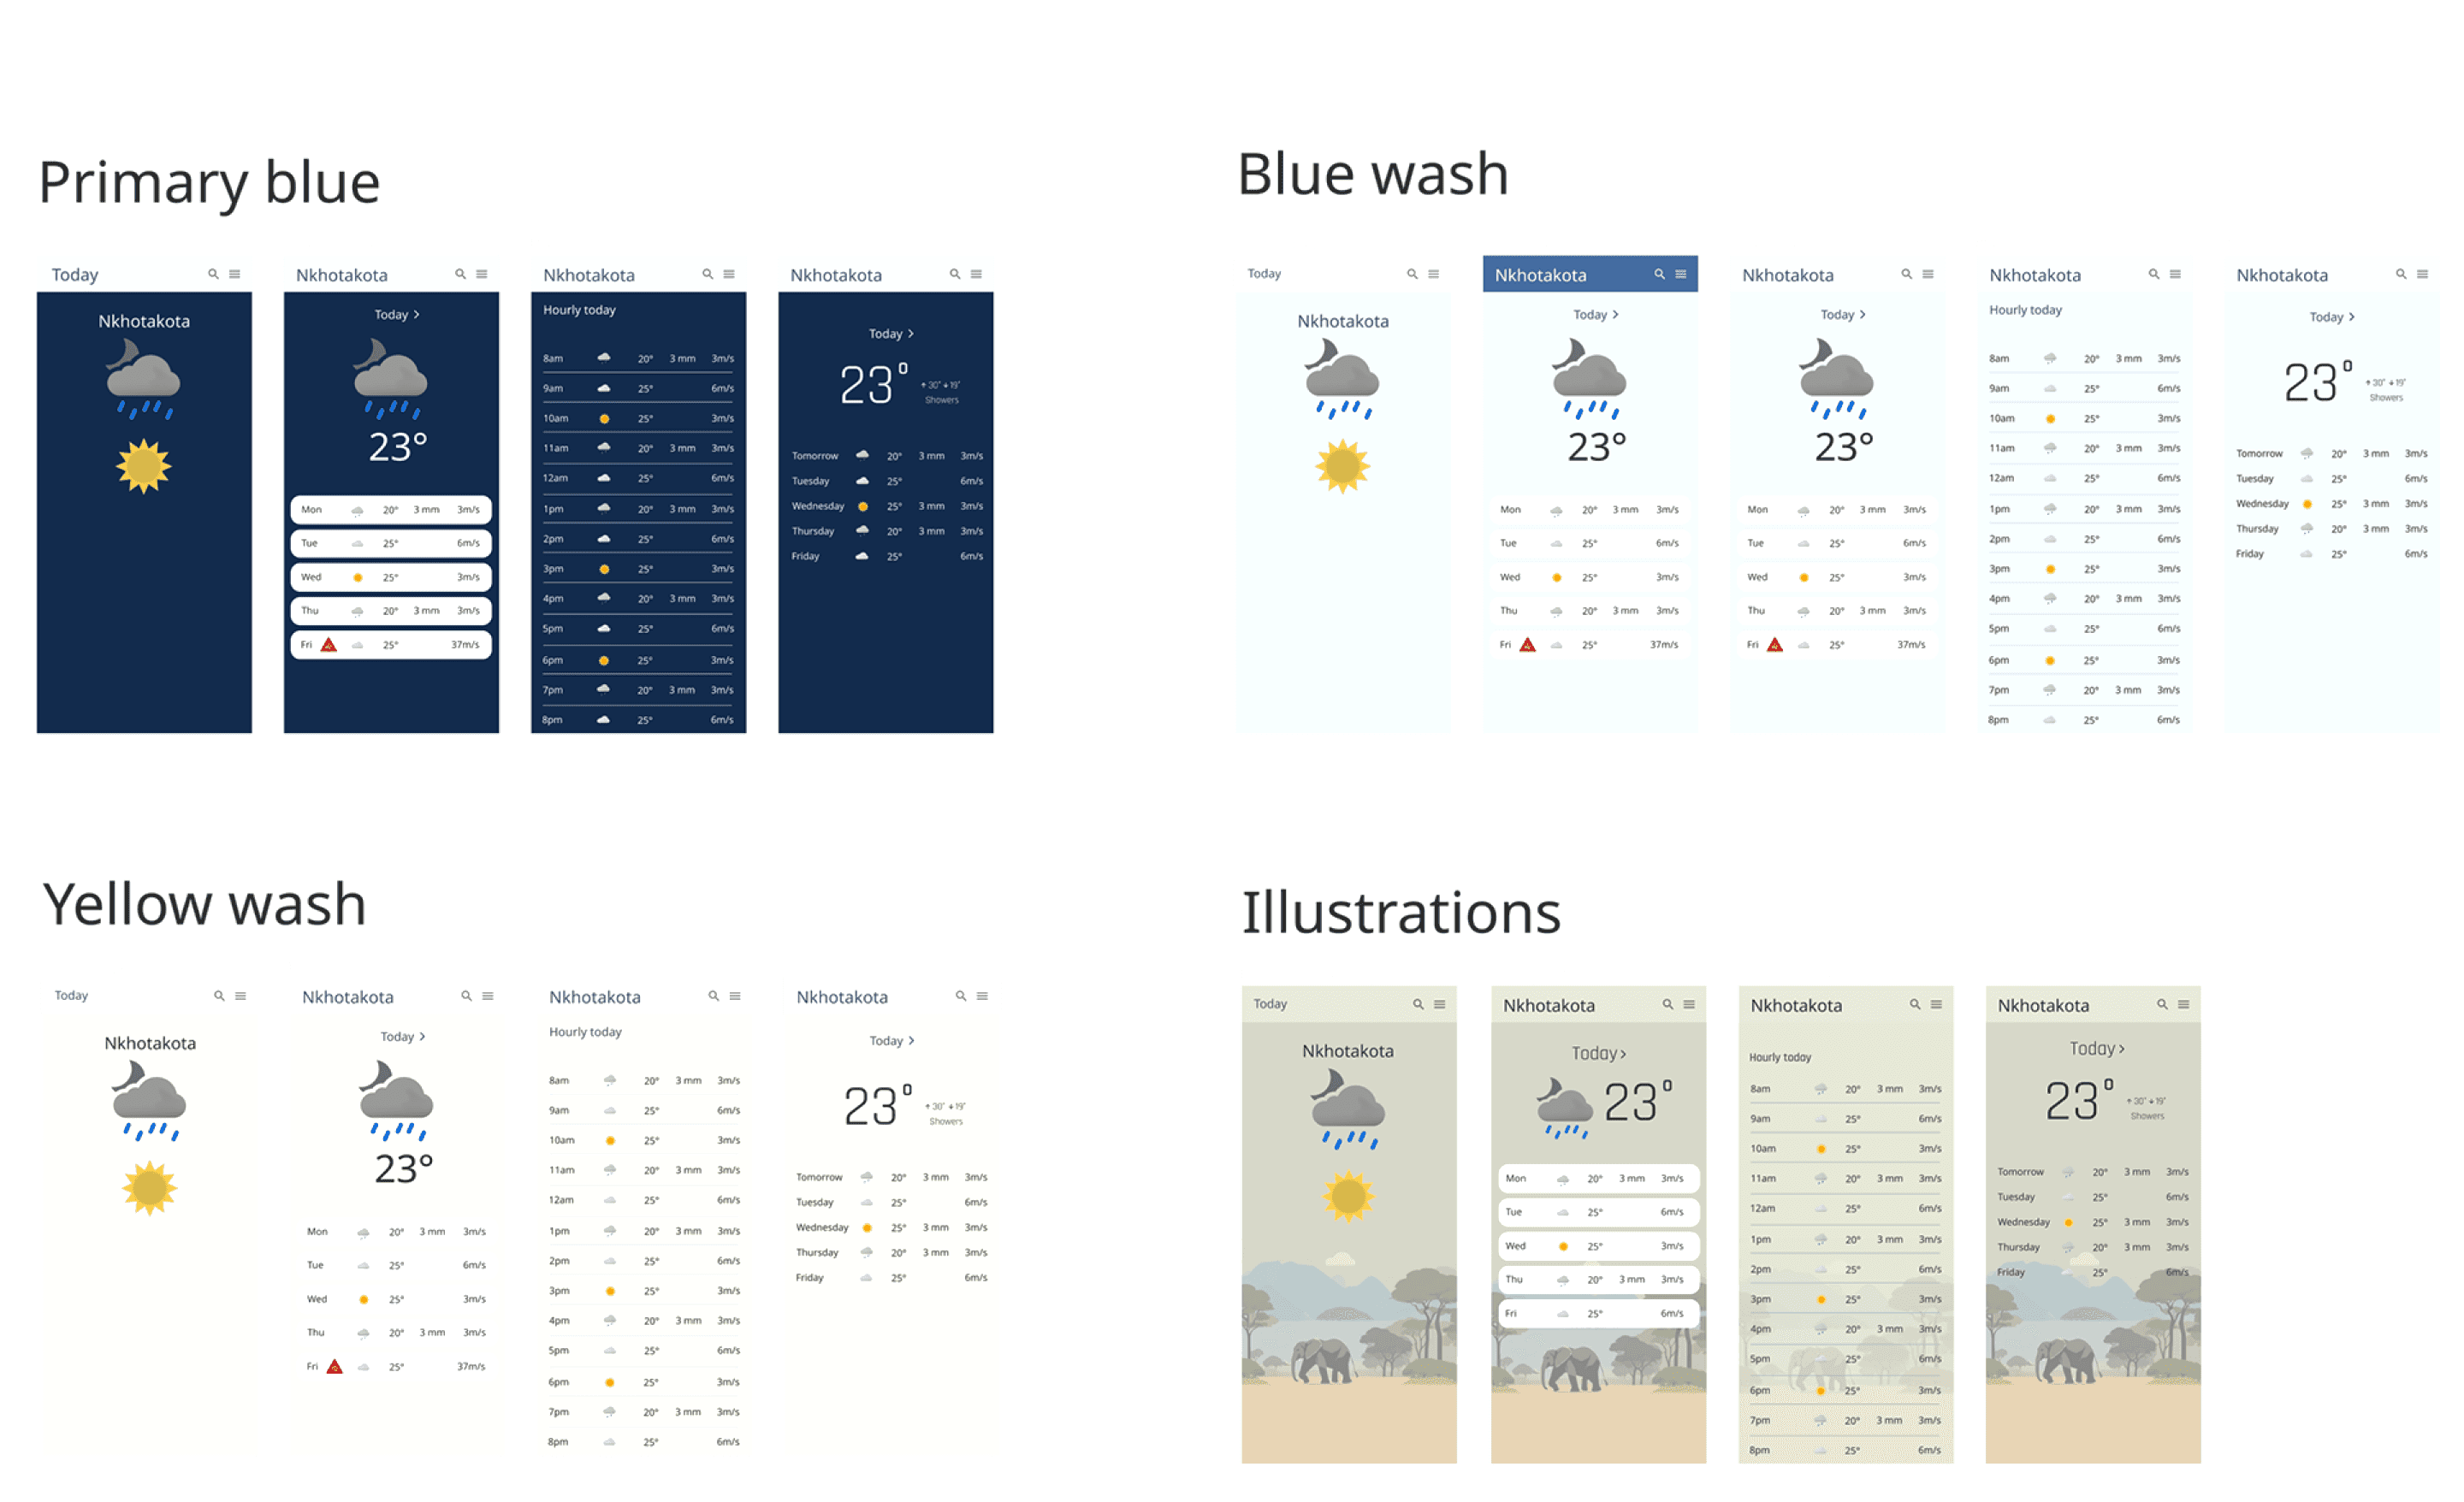
- New design direction added. Two months before release a new CMS was acquired by Malawi MET. This CMS has a distinct design that differs vastly from our current one with elephant illustrations. This has taught me the importance of a design system, and how next time I will be even more diligent when creating it!
- Facilitating user research in a country I had never visited was different. To solve this challenge we partnered up with Save the Children / Redd barna, who were on the ground in Malawi helping us with user research.
- Inconsistent interview notes. As 11 interviewers had different ways of note-taking from the interviews and user tests, not all the data was comparable. In retrospect, I would have been more diligent about how the interviews should have been narrated.
Remoting
When designing, it’s tempting to sit alone in a corner with headphones on and strive for magic! In this project, I was working with forecasters and developers with varied backgrounds, so I chose to share my process and unfinished sketches every day in standup. I explained the reasoning behind exploring a particular direction and why it proved unsuccessful, resulting in its abandonment. I also showcased what did work and the rationale behind those choices. This transparent approach significantly reduced the need for extensive discussions.
High-fidelity design
After getting the go-ahead on the direction with illustrations, we dived into the details, adding features. I created components with variants in the design system, adding details and a grid for the developers. Our front-end developer in Malawi is highly skilled, and development went at record speed.